World Community Grid turned 1 a couple of weeks ago. As a result they sent out a Newsletter to keep its members updated on its progress. Last week they initiated a new program called FIGHTAIDS@HOME.
Like the Proteome Folding Project, it also uses computer power to reduce statistics for achieving its purpose. The difference is that this project looks at the affinity of an already engineered molecule to HIV Protease as supposed to the Proteome Project where they simulate different potential folds to successfully engineer a new molecule.
Like the Proteome Folding Project, it also uses computer power to reduce statistics for achieving its purpose. The difference is that this project looks at the affinity of an already engineered molecule to HIV Protease as supposed to the Proteome Project where they simulate different potential folds to successfully engineer a new molecule.

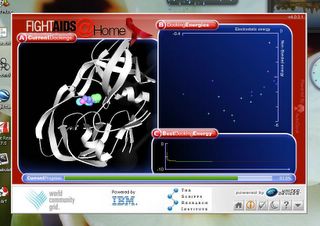
Figure 1. A. A cartoon crystal structure of HIV protease bound to a potential inhibitor molecule. B. A plot depicting the bond energy experienced by the molecule at different conformations. C. Best docking Energy.
In Figure 1A you can see the structure of the HIV protease in monochrome, or grey. The coloured molecule in the middle is the Protease Inhibitor. It has bound or docked in the active site of the protein. In doing so, it renders the protease inactive because the HIV protease is unable to bind to the proper HIV proteins. This can delay the onset of AIDS (when CD4+ T cells falls less than 200 cells/μL) because proper cleavage/cutting of proteins is critical for full maturation of the viral particle. For example, the viral proteins are produced in a long string and require the protease to seperate the proteins so that proper folding and functionality can occur.
Figure 1B is a plot showing docking energy i.e. how strong the interaction is between the protease inhibitor and the HIV protease. A higher energy would mean that the complex is more stable and it also is more able to compete with HIV proteins for docking sites in the proteases. So higher energy = higher affinity = much better inhibitor.
Figure 1C is apparently the best docking energy grpah. Im not really sure how it works because it seems to exponentially fall to a plateau. Not really sure how to go about reading that. Any opinions would be appreciated. Otherwise when it hits me in my sleep, i can update this entry.


